Measuring the Internet is hard, but also extremely revealing.
My research over the past year has taken a few different paths. Primarily, it’s been a case of looking at and understanding the technical aspects: the relationship, for example, between an Internet traceroute and BGP tables, which supposedly record the links between networks that a traceroute should capture. Or, simultaneously, whether we can replicate any of the Internet’s routing behaviour outside of the Internet - including filling up routing tables to see the impact of a table overflow; or simply how effectively different routing products are able to communicate.
But through the course of seeking to answer these technical questions, I’ve had the opportunity to explore some of the less-technical and more “human” aspects: What are we able to see in Internet routing data about humans and geography?
Jurisdiction and the Internet
Intuitively, because the Internet spans many countries, it cannot be regulated by any single one of them. To do so would be to subsequently also be regulating the citizens of another country – and therefore acting beyond the scope of their jurisdiction. This isn’t so much a problem for the regulating country, but it tends not to be appreciated much by the citizens of the other countries, or more acutely, their governments.
But in reality, we’ve seen a considerable amount of new Internet regulation in recent years, such as the EU’s Digital Services Act, legislation around telecommunications infrastructure resiliency, and in the UK, regulation aiming to improve online safety. Discussing the relative merits of each could, and probably will be, long enough to write a book, and so I won’t delve into that here. But what is also interesting is the impact of legislation on the shape of the Internet - and that’s what we explore here.
We ask three different but related questions:
- Does the topology differ between countries?
- How does the topology differ between countries?
- Why does the topology differ between countries?
Our approach
The RIPE NCC, University of Oregon and Packet Clearing House (PCH) each have projects collecting Internet routing table data from a large variety of globally distributed points. For the RIPE NCC, this takes the form of the “Routing Information Service” (RIS), for the University of Oregon, it is RouteViews, and for PCH it is simply available on their website.
We use this data, capturing it for a given period in time, and infer relationships between Autonomous Systems (ASes) - which are effectively the networks of organisations like ISPs or large digital service providers.
In this data is expressed, for each collector, a path from it to a variety of other ASes, known as the as_path. It takes the form of something like [123 234 345 456], and indicates a route between AS123 and AS456 traversing AS234 and AS345. We therefore take as adjacent each pair in this list: AS123 and AS234, AS234 and AS345, and AS345 and AS456. I’ve released some of the early code I used to do this process as a GitHub repository, but I hope to make the complete code public when I’ve finished making it platform-agnostic.
Alongside this, we also collect public traceroute measurements using RIPE Atlas. Many of the measurements made using the tool are accessible for analysis, and we collect this data to validate our inferred BGP data, as well as to discover new links that may not have been visible, perhaps as a result of private peering. An example of one such traceroute is below.
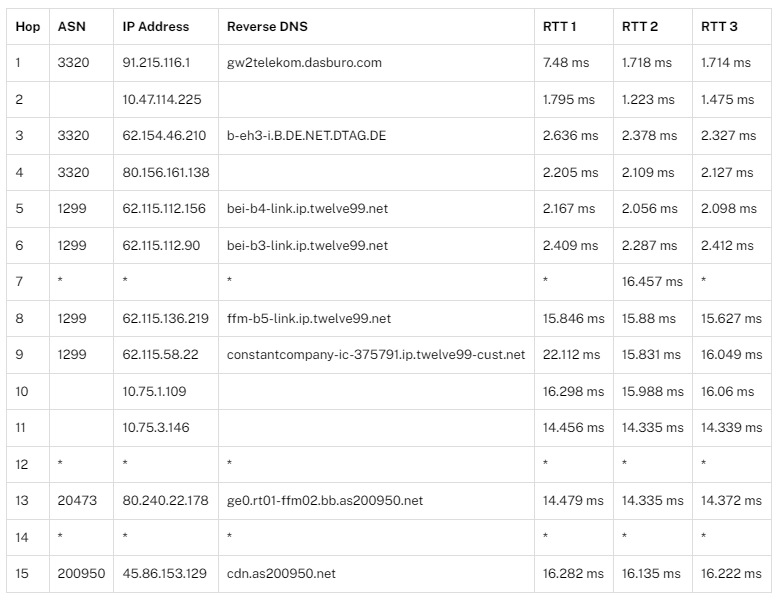
In the traceroute, we can summise that AS3320 and AS1299 are likely to be adjacent, and there is a possibility that AS1299 and AS20473, and AS20473 and AS200950 adjacent. In the first pairing, there are no additional steps observed between the two ASes in the traceroute path, however in later steps the relationship is likely but not conclusive as there is an ICMP timeout or non-response (*), which may correspond to a router configured not to respond. By collecting larger volumes of data it may be possible to observe the nature of the timeouts.
We supplement the data collected with metadata from the Internet registry (via RIPEstat) to determine the country of registration for each AS. Some ASes are registered in one country, but actually span multiple, and so we additionally collect geolocation data for the IP addresses of observed routers (such as those in the BGP table or traceroute) to identify this. This approach is not immune to error - many geolocation providers also use Internet registry data as a foundation for the dataset.
An additional challenge is identifying ASes belonging to the same organisation, which is useful for later analysis. This is particularly complicated as the way this is recorded differs between each of the five main Internet registries, and approaches to pseudoanonymously recording ASes owned by the same organisation with opaqueId records are inconsistent across time. I’m not completely sure of the motivations for this nor the utility of such inconsistency, so I personally summise this is some form of historical debt that continues to be unserviced. To help us, we also use self-reported data from PeeringDB, but as with all self-reported data, it is unlikely to be completely trustworthy.
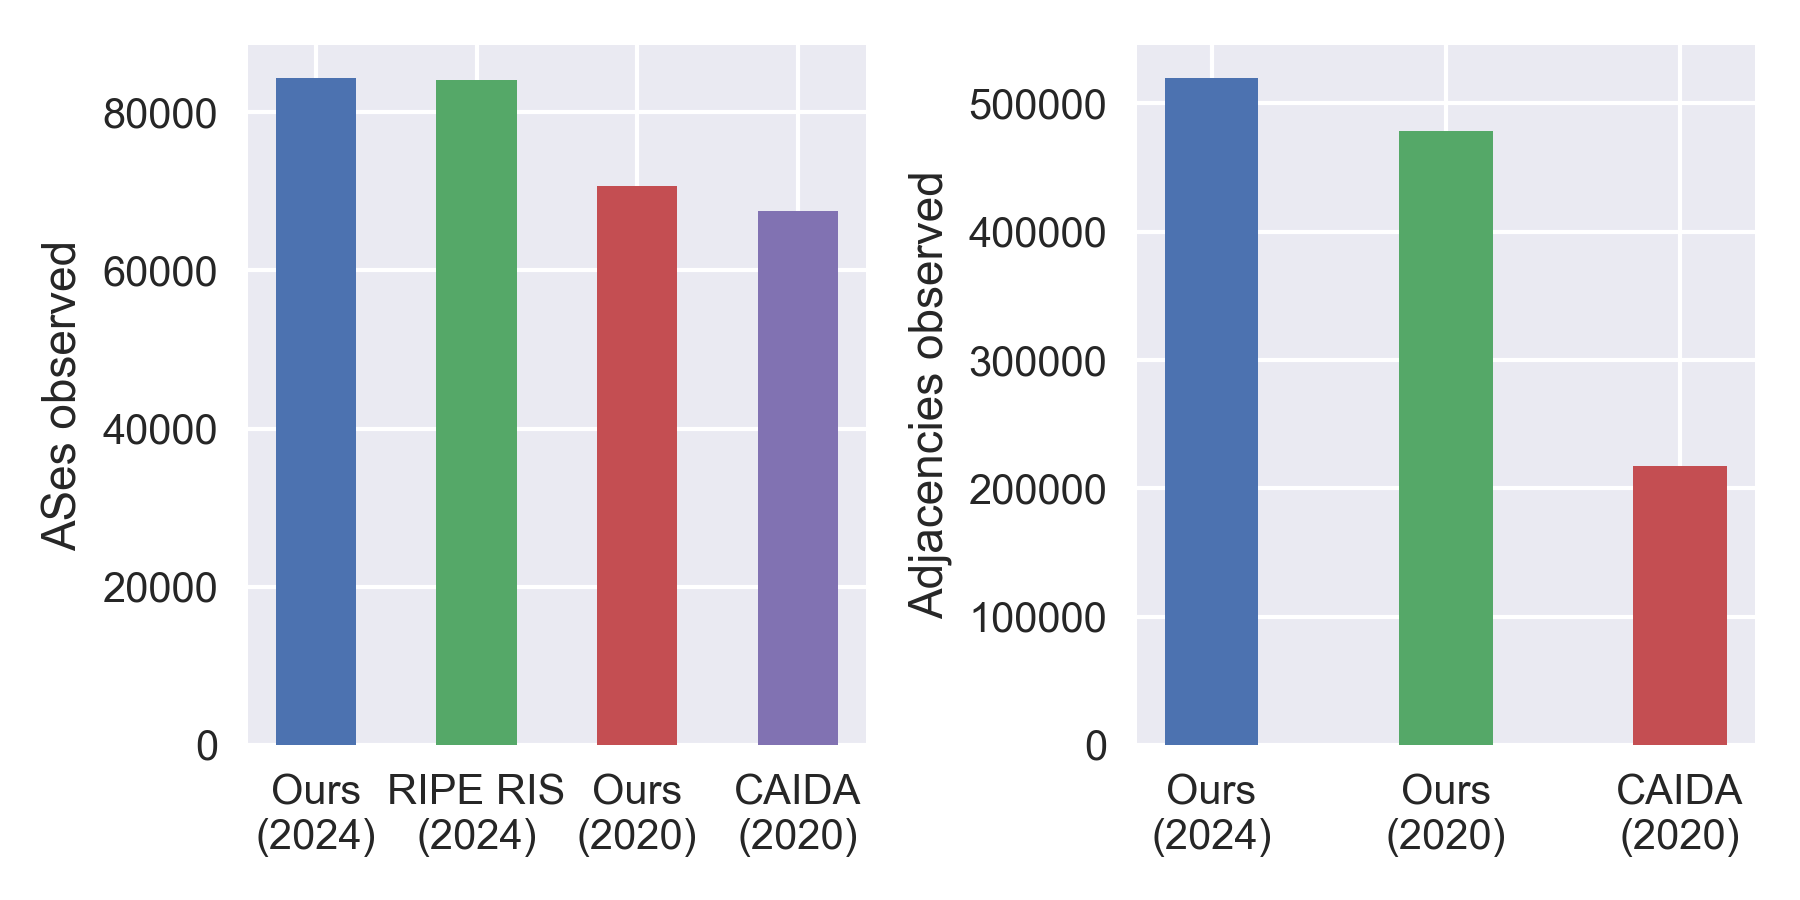
Our snapshot for the following analysis is from the 1st May 2024. A comparison of our approach and that of notable others is below:
1. Does the topology differ between countries?
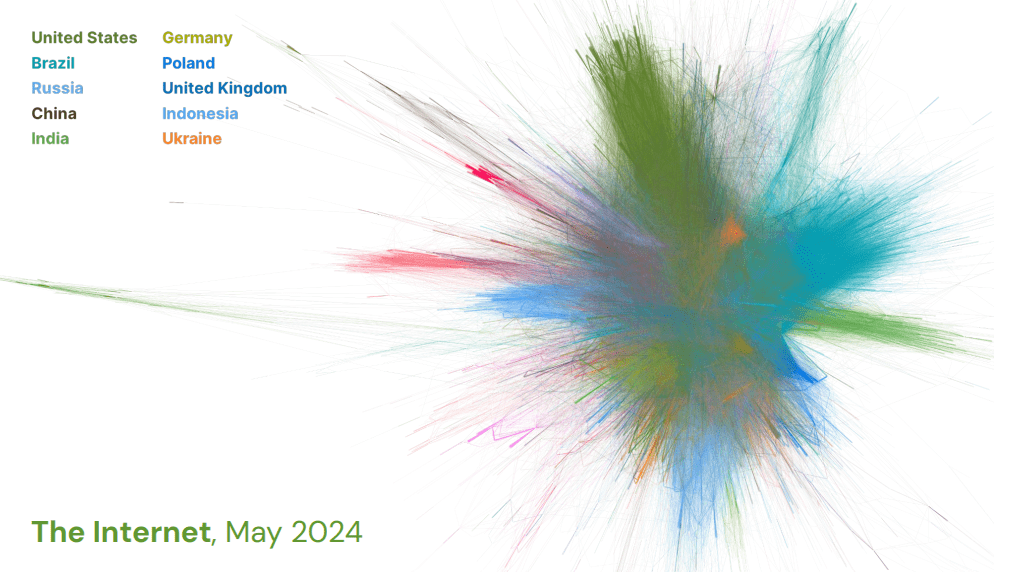
Above is a force-directed plot of the Internet from May 2024 in which we have allocated a colour for each of the ISO-3166 countries observed in the topology capture. Nodes closer to the centre of the plot have a higher degree of interconnectivity, and those moving towards the edges have a lower degree - meaning they are less connected. What we would expect in a “utopia” is for all nodes to have similar levels of connectivity, and thus for a tightly-connected centre and no diverging edges. In the graph, this is clearly shown to not be the case.
At the top of the plot (in a dark green) we observe the connectivity of the United States, and in the blue on the right emerges the connectivity of Russia. Then on the left side, we see a strongly diverged green strand - the networks of Iran. We would observe similarly of China, but that is repelled so distantly downwards it is difficult to capture in a format for this post.
In the centre is a tight collection comprising of the networks of many different countries, including the vast majority of Europe. But at the edges, we see clear divergence from the tightly interconnected mesh. It is evident statistically, but pronounced quite clearly visibly: Internet topology does differ between countries.
2. How does the topology differ between countries?
At this point, our analysis becomes more complex. To be able to compare topology difference, we need to introduce some way of determining where geopolitical borders (such as those that separate countries) sit on the Internet. We simplify the task slightly by only recognising the registered home of an AS as its country. On a geopolitical level this should not be too influential as the presence of such an AS in another country’s topology is likely to be indicative of strong geopolitical links (and indeed we find this to be true in our wider research).
Therefore, using countries of registration, we deem a neighbour to be foreign where its country of registration is different. We show this below, where AS6939 is foreign to AS64497:

In the wider Internet context, we consider upstream to be the provider of service to an AS, and a downstream to be an AS for which service is provided. In this particular context, we use the same analogy to discuss international connectivity. Relative to a geopolitical border (where a foreign AS connects to a domestic AS) we say that upstream refers to the ASes in the foreign direction, and downstream in the domestic direction. We use this looser definition specifically in this context as we are considering only the geopolitical connectivity between ASes and not purely business dependency (albeit an overlap is likely).
We therefore calculate the number of unique upstream neighbours: the ASes at each upstream step that have not yet been seen and are not domestic ASes. The graph for this is shown below:
At this stage, we can start to see a trend emerging where countries in which we know to have higher censorship are exhibiting a characteristic where the unique upstream neighbours in the first two bars decrease. This also happens at a minor level for the United States - possibly partially explained by the extreme dominance of the US over the Internet resource space and overwhelming number of domestic ASes.
We also see topological differences in connectivity visualisations. Using the Kamada & Kawai approach we show the ASes most central to a country’s network in the centre of the graph and those of lesser importance at the edges. ASes closest to the centre are therefore most likely to be tier 1 and tier 2 connectivity providers.
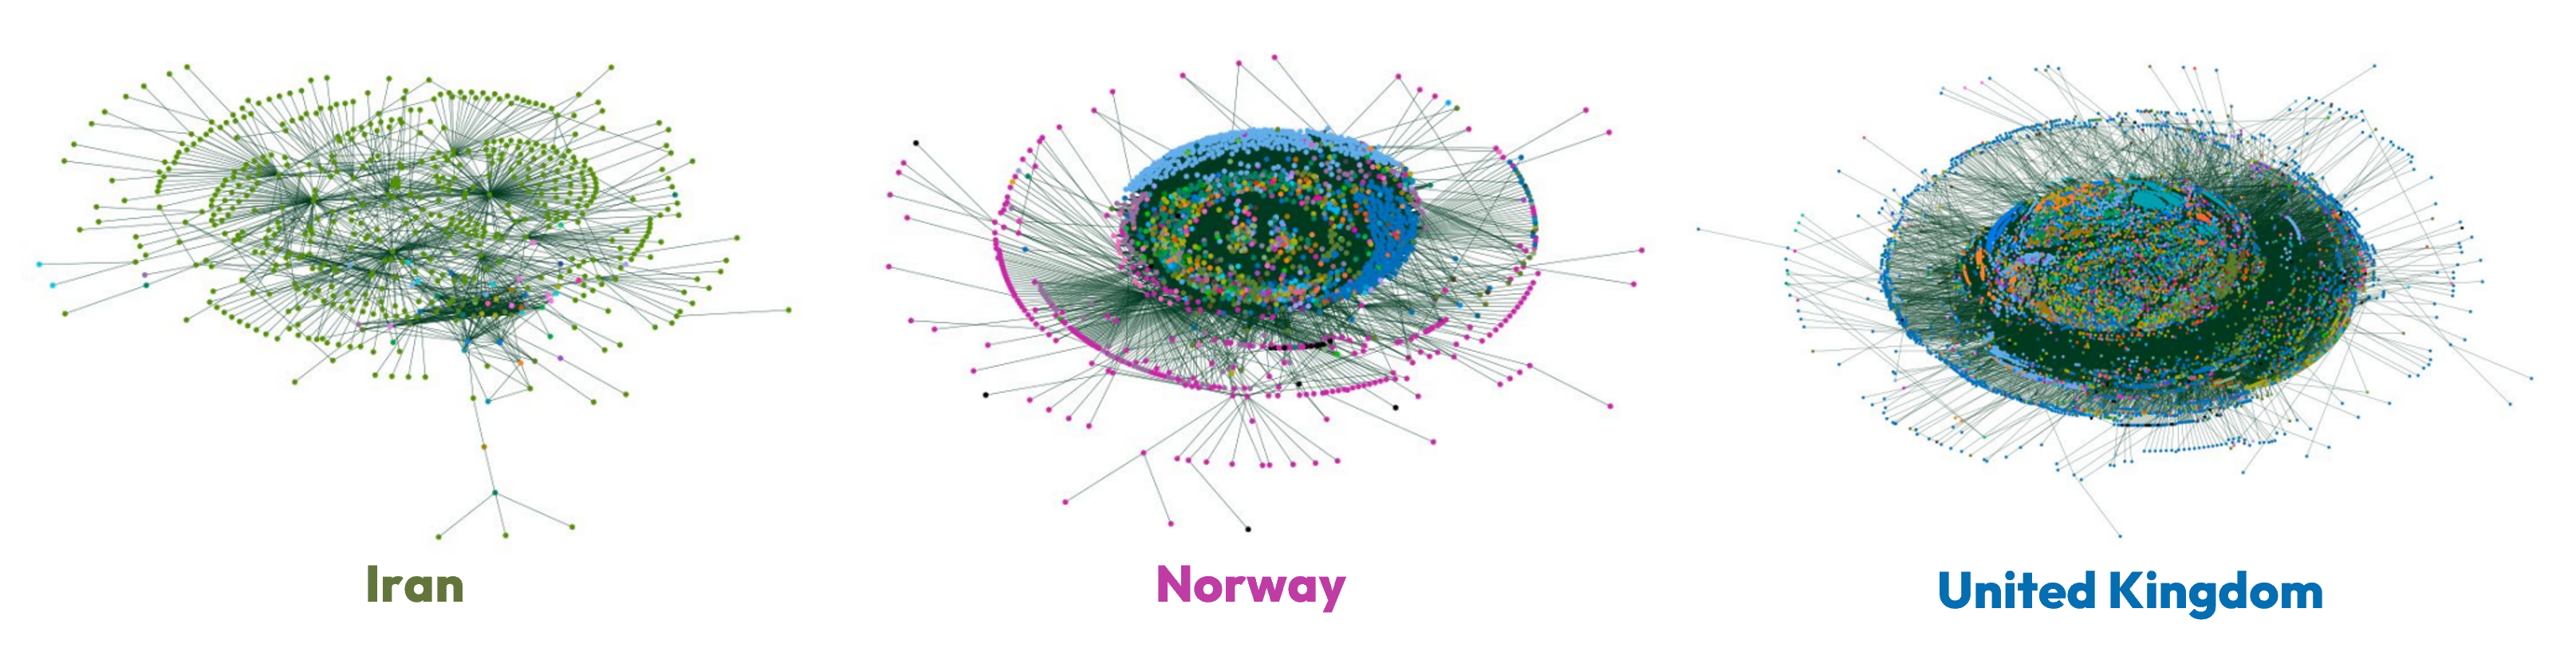
In Iran’s topology, we see its very small number of foreign neighbours pushed to the very edge of the graph, and very little connectivity to any of them - often from only one or two domestic ASes. In effect, this means that Iranian outbound traffic must traverse these ASes to reach the wider Internet. The opposite is true for the topologies of Norway and the United Kingdom. In both examples, domestic ASes are largely present on the edges with a strong foreign neighbour presence at the topology core.
This is a really interesting trend, and one we see reflected in a number of countries.
3. Why does the topology differ between countries?
One possible - and in my view the most likely - explanation for this difference is the enforcement of Internet censorship in different countries. In countries with much higher Internet access regulation, we see a more Iran-style Internet topology, where foreign neighbours are only accessible through a small number of domestic nodes. In many ways, this makes practical sense, and follows the logic of our earlier discussion around regulatory jurisdiction in an Internet context.
If it is not possible to globally enforce Internet regulation, steps towards regional implementation would have to be taken to make regulation effective.
We consider, for example, large blocs like the EU. EU-mandated data protection and cookie notice practise is largely isolated to only users in the regulated countries as international providers deliver regionally-restricted versions of their websites to their EU customers whilst continuing to serve no cookie notices to other customers in the rest of the world.
But I’m sure many EU users have visited a website without seeing a cookie popup, so this obviously isn’t completely effective. What practical steps can governments take to enforce their Internet sovereignty?
Censorship.
By intercepting Internet traffic, a government can take steps to block traffic to sites they deem undersirable, the definition of which obviously varies substantially. In the UK, steps by government to block sites (primarily for intellectual property rights and content deemed harmful) is largely taken by court order against ISPs alongside likely informal arrangements. A similar but far more extreme decentralised approach to censorship is also present in Russia, where they operate a single register of blocked sites enforced by Russian ISPs, alongside complementary legislation intending to enable an Internet disconnection of the “RuNet”.
Aside from Russia, however, most countries with a more highly censored Internet have this done at a less decentralised level. In Iran, like in most such countries, almost all international bound traffic traverses a handful of domestic ASes before reaching foreign nodes. For Iran, this means traversing ASes which are owned by the “Telecommunication Company of Iran”, an almost entirely state-owned entity, at which point the government is able to intercept almost all traffic and enforce domestic restrictions.
The impact of these constriction points is evident in topology: in more highly censored countries, there is a “funnel” formed, much like in a sand timer, between domestic topology and foreign neighbours.
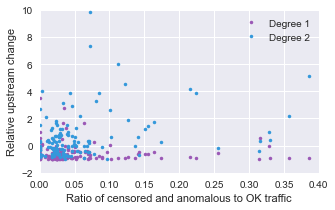
To enable the analysis of this shape at a global scale, we use data from the Open Observatory of Network Interference (OONI), and calculate for each ISO-3166 country the ratio of censored and anomalous against “OK” or normal traffic. Where the ratio is higher, the level of Internet censorship is therefore also likely to be higher.
Plotting this against the relative upstream change metric we presented previously:
A relationship is emerging as we move to progressively more foreign degrees: degree 1 being the first degree of foreign neighbours and degree 2 the next step.
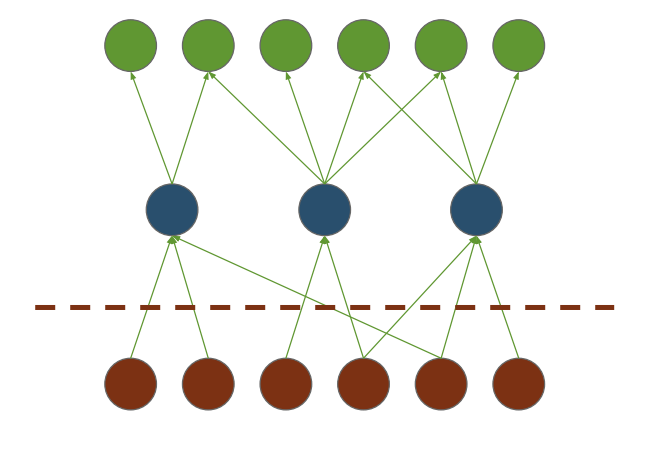
We accentuate this relationship by looking at the cumulative downstream burden: starting with the number of domestic ASes dependent on a given foreign-facing domestic node for international connectivity, moving progressively downtream in the domestic direction.
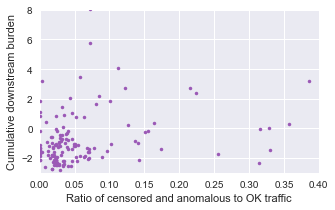
Here, we start to see a correlation between the two. As the amount of interference or censorship increases, the cumulative downstream burden is also increasing (with a correlation coefficient of 0.5). Therefore, there is a sand-timer-like funneling effect occuring within the topology of more censored countries.
Finally, when we adjust this cumulative downstream burden metric to combine ASes owned by the same organisation, we provide a final graph:
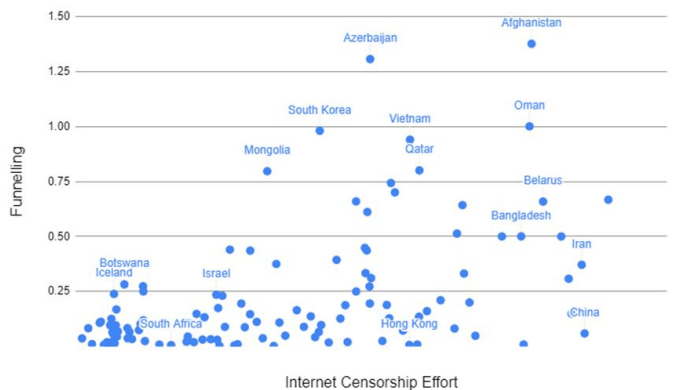
We see a much clearer distinction. A higher level of censorship is generally equating to a higher level of funneling - an Internet topology bottleneck for outbound traffic. What’s interesting is a second relationship is also starting to emerge in this graph, beyond censorship.
In some cases, where we’re seeing high levels of funneling, we also see countries with higher geographical restrictions. For instance, South Korea exhibits a higher level of funneling, which could be explained by its proximity to only neighbours of high Internet censorship, like China and North Korea. But, notably, this is also a geopolitical trend - albeit with another possible explanation.
A few conclusions
Geopolitics is having a statistically significant impact on the the shape of Internet topology - a trend I anticipate continuing to grow as Internet sovereignty and digital provider regulation continues to expand in different countries.
There are a few possible explanations for this. Here, we’ve looked at Internet censorship, which has a demonstrable relationship with the shape of Internet topology, but it is clear it is not the only explanation, as we also see an emerging relationship with geographical trends.
Recording and slides
This blog post was based on a presentation I gave recently at RIPE 88 about architecture and routing in a geopolitical world, a recording of which is available below, alongside the slides. I’ve also explored the relationship further in a paper available as a preprint on arXiv.